Greenhouse Gas Emissions
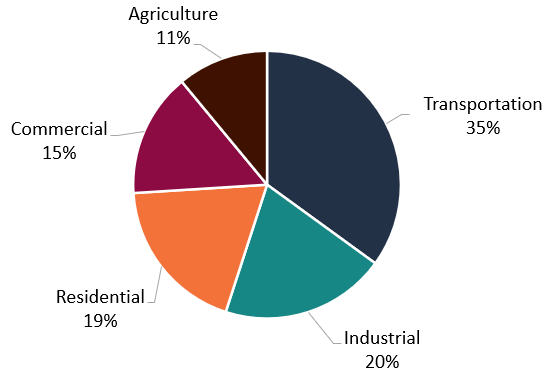
Greenhouse Gas Emissions by Sector (2022)
Most of Oregon’s greenhouse gas emissions come from the energy we use every day. These GHG emissions contribute to climate change.
Most of Oregon’s greenhouse gas emissions come from the production or use of energy. The state categorizes and reports GHG emissions for five end-use sectors — transportation, residential, commercial, industrial, and agriculture.
Transportation is the largest source of sector emissions, contributing over a third of Oregon’s total GHG emissions. The residential and industrial sectors each contribute about 20% of state emissions, and the commercial sector contributes 15%. Together, energy consumption makes up nearly 90% of Oregon’s greenhouse gas emissions.
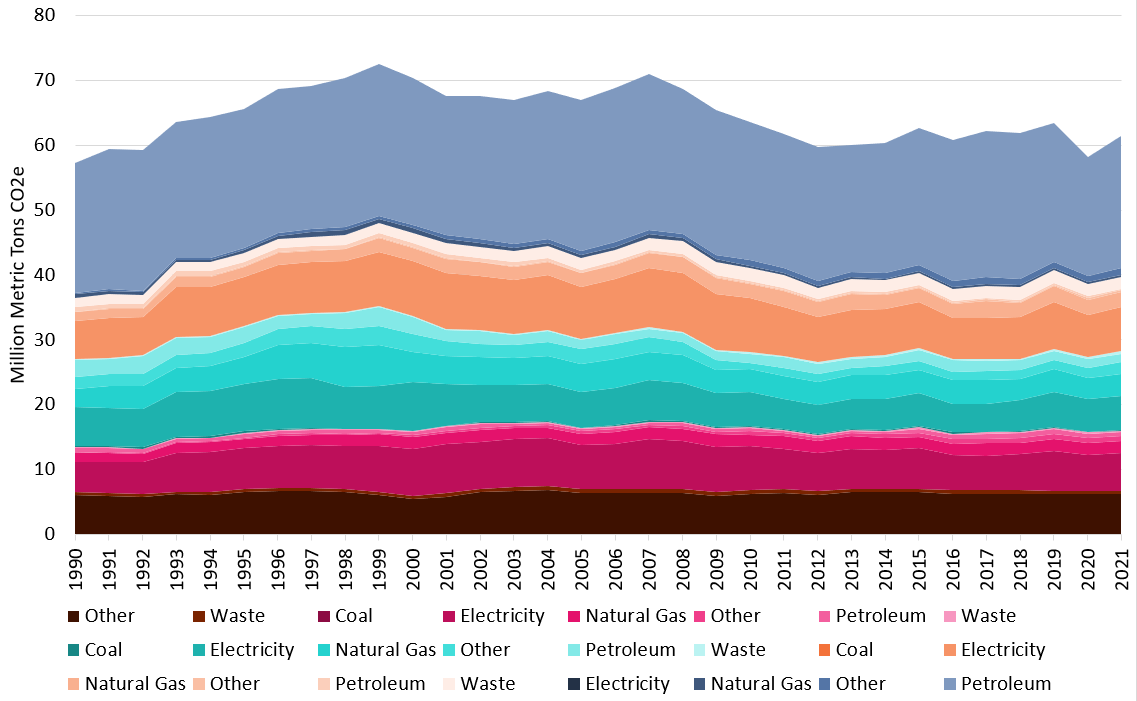
Oregon Greenhouse Gas Emissions Over Time
Viewing these data over time shows the variety of emissions sources in Oregon and emissions trends from these sources over time. This level of analysis informs policy makers about what policies will most effectively reduce emissions and meet state goals.
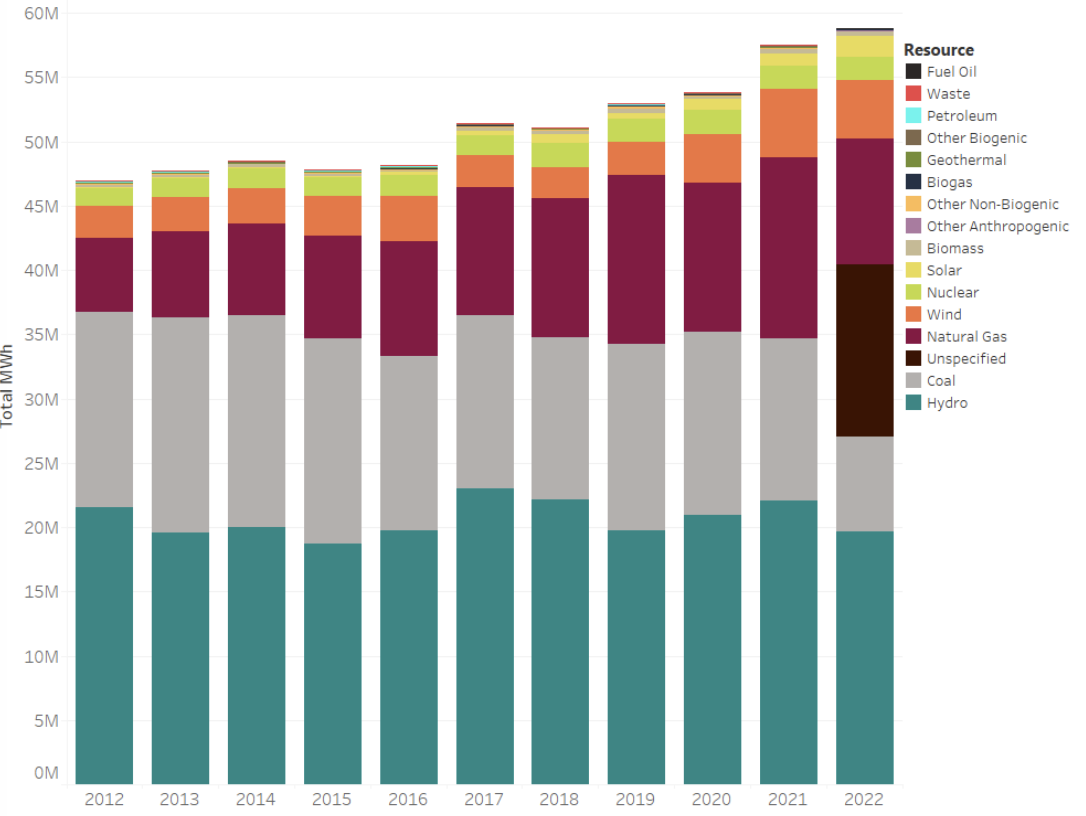
Oregon’s Electricity Mix Over Time
Renewable energy makes up an increasingly larger share of the mix each year. In 2021, the Oregon Legislature passed House Bill 2021, requiring Oregon’s largest electric utilities, Portland General Electric and Pacific Power, to reduce greenhouse gas emissions to 80% below baseline emissions levels (average from 2010-2012) by 2030, 90% below by 2035, and 100% by 2040.
Oregon’s electricity resource mix displays the proportion that each resource (solar, wind, hydropower, etc.) contributes to the total amount of electricity that Oregonians consume each year. Hydro is still a predominant resource for the region. Coal continues to decline as plants are shuttered, and natural gas, wind, and solar are increasingly a larger proportion of the mix.


