Energy by the Numbers

Oregon’s Energy Story

Oregon’s energy story has evolved over time thanks to new technologies, resource availability shifts, and policy changes. While the Pacific Northwest has a long history of using hydropower, 20 years ago, solar- and wind-generated energy was scarce. Today, Oregon’s energy resources are diverse. In the chart at right, start at the left to see imported energy and energy produced in Oregon. The numbers represent trillions of Btus of energy.

The energy lines flow from left to right to show the different types of resources (hydro, natural gas, solar, and others), and where they end up in Oregon’s energy story — from transportation fuels to the natural gas and electricity that supply homes and businesses. Some energy ultimately goes unused and some is exported to other states.

Full Energy by the Numbers Section

Oregon Energy Flow Diagram
The numbers in the diagram represent trillions of Btus of energy. A British Thermal Unit is a measurement of the heat content of fuels or energy sources. Btu offers a common unit of measurement that can be used to count and compare different energy sources or fuels. Fuels are converted from physical units of measurement, such as weight or volume, into Btu to more easily evaluate data and show changes over time.

Oregon’s Energy Consumption Over Time

Oregon saw an overall trend of increased energy use for almost four decades—an average of 3.6 percent growth per year from 1960 to 1999. During that time, we shifted from a reliance on fuel oil and wood to increased usage of natural gas and electricity in our homes and businesses. Oregon reached our highest consumption of energy in 1999. Since then, total energy use has been decreasing.
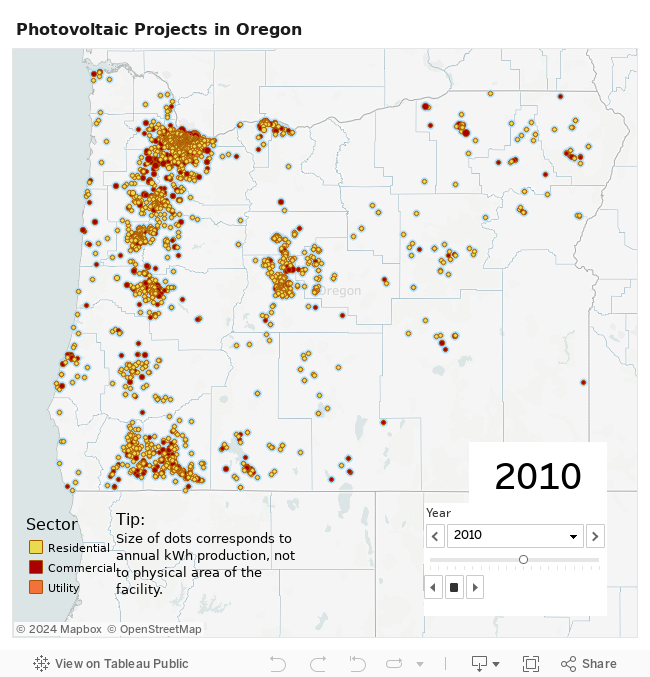
At a Local Level

Oregon Counties
Profiles for each Oregon county provide residential data related to population, demographics, income, energy and transportation burden, and household characteristics. The profiles paint a picture of how energy is used in each county, along with the nexus between energy and other important community attributes.

Consumption+over+time.png

2020 BIENNIAL
ENERGY REPORT

Ber Header Photo.JPG

Energy 101

How Energy is Produced, Used, and Transformed

This includes fundamental information for people new to energy or specific energy topics, along with those looking for data or a central place to help tell the story of how energy systems affect their work and interests. Narratives range from basic information about where our transportation and natural gas resources come from and how they get to consumers, to the role that codes, standards, and net-zero buildings play in reducing overall energy use.

Full Energy 101 Section

Energy Production Categories

Electricity
Much of the electricity generated in-state uses Oregon-based natural resources – wind or hydropower, for example. Oregon energy facilities also generate electricity using raw materials from out of state. All of the coal and almost all of the natural gas used at Oregon’s large scale in-state coal and natural gas power plants is imported. Oregon does produce renewable natural gas and biofuels that are used to generate electricity, they are also sometimes used for combined heat and power at mainly commercial and industrial facilities in Oregon.

Direct Use Fuels
Direct use fuels include small amounts of natural gas and a variety of biofuels produced in-state: hog fuel (wood chips) used for industrial heat, commercial wood pellets for commercial industrial heat, renewable natural gas and other biofuels used for combined heat and power, and others.

Transportation Fuels
Oregon produces about 25 percent of the biofuels our transportation system uses; overall, biofuels make up 6.4 percent of Oregon’s use of transportation fuels.

transmissionandchristmastrees.jpg

Electricity Transmission

Transmission lines move large volumes of high-voltage electricity across long distances and are needed to connect large distant generating resources to electricity customers (also known as load centers). Transmission lines create a networked system by interconnecting a variety of load centers to generating resources. Most generators are located long distances from the towns, cities, counties, and rural areas they serve.

Energy and our daily lives

The second part of the story is how energy systems affect the lives of Oregonians. Information in this section includes an explanation of energy bills and how net metering works for technologies like rooftop solar. Readers can then learn more about the very real challenges of energy burden in our state, along with the growth and opportunities of clean energy jobs in Oregon.


Resource Reviews

RAPID ADVANCEMENTS IN TECHNOLOGY HAVE RESPONDED TO AND PIONEERED CHANGES IN OUR STATE AND ACROSS THE WORLD.

The technologies examined in the gallery are those that are prevalent in Oregon. Many of these technologies place Oregon and its communities on the forefront of a cleaner, more sustainable future.

They help Oregon meet its climate and energy goals by enabling cleaner and more efficient fuels and resources. They offer opportunities to invest in Oregon’s economy by creating energy-related jobs to maintain our energy system and develop new projects. They can make us more resilient by enabling us to maintain or restore our energy systems when disruptions occur. And beyond these opportunities and benefits — they are just so cool.

Full Technology Reviews Section


A Shout Out for Solar

Solar energy is a viable resource throughout Oregon, generating electricity across the state. In 2018, utility-scale, commercial, and residential solar generated approximately 776,000 MWh or 1.2 percent of all electricity generated in Oregon (18th among all states).

Oregonians consumed approximately 680,500 MWh accounting for 1.3 percent of all electricity consumed in Oregon. Oregon solar grew over five-fold between 2015 and 2019, with installed capacity growing from 91 MW to 592 MW, and generation increasing from 116,000 MWh to 776,000 MWh.


FUEL CELL ELECTRIC VEHICLE (HYDROGEN CARS)

Hydro car.png

Fuel cell electric vehicles (FCEV) or hydrogen vehicles, are similar to battery electric vehicles (BEV) because they are powered by an electric motor-based drivetrain. However, instead of a large pack of batteries as the source of the electric energy, FCEVs store energy as hydrogen in a fuel tank. Fuel cells use oxygen to split electrons from the hydrogen molecules to create the electric fuel that powers the vehicle, thus the name – Fuel Cell Electric Vehicles.

Fuel cell electric vehicles (FCEV) or hydrogen vehicles, are similar to battery electric vehicles (BEV) because they are powered by an electric motor-based drivetrain. However, instead of a large pack of batteries as the source of the electric energy, FCEVs store energy as hydrogen in a fuel tank. Fuel cells use oxygen to split electrons from the hydrogen molecules to create the electric fuel that powers the vehicle, thus the name – Fuel Cell Electric Vehicles.

Learn more about FCEVs


Policy Briefs

This section of the report provides insights on emerging energy trends, opportunities, and barriers in the energy sector. ODOE began the development of this portion of the report by listening – and then identifying the critical energy questions and issues that we heard from stakeholders, policy makers, and the public. ODOE applied a data and equity lens in determining topics for this policy briefs section of the report – are these questions being asked by people or entities that have historically not been at the table? Do we have the data and information to help answer these questions?

Full Policy Briefs Section

Popular Topics

Equity in State Renewable Energy Programs

Oregon has been a leader in development of renewable energy for many years. Customer-owned or on-site renewables can provide individual financial benefits, societal benefits associated with clean energy production, and economic development associated with jobs to install systems. However, access and benefits of on-site renewable energy systems have not been enjoyed by all Oregonians.

This section will review a number of ways in which Oregonians have gained access to renewable energy including customer or community sited systems, utility voluntary green power programs, and acquisition of large-scale renewables by utilities. This policy brief also acknowledges that access to renewable energy does not necessarily ensure equitable distribution of benefits as many access options require significant financial investments by consumers.


Full “Equity in State Renewable Energy Programs” Brief


Energy Efficiency

In 2020, energy efficiency continues to be a cornerstone of Oregon’s energy policy. As the least-cost and priority resource, energy efficiency is second only to hydropower in terms of meeting the region’s electricity needs. The Pacific Northwest region has achieved 7000 average MW of energy savings since 1978, resulting in millions of dollars in savings for Oregonians.

This section examines two trends that have developed since 2018: the region is no longer on track to meet its electricity energy efficiency goals for everything from greenhouse gas reductions to equity, and at the same time, Oregonians are recognizing and seeking co-benefits of energy efficiency.


Full “Energy Efficiency” Brief

Capitol Building, Salem, Oregon


 Our report is best viewed in Google Chrome, Firefox, or Safari browsers.

Please feel free to use our charts/tables for your reports or research (with attribution). If you need help downloading a specific graphic, please email AskEnergy@oregon.gov.

Provide feedback or request a presentation on specific topics for your organization through our online comment form.


(Large File Size)

Table of Contents

By the Numbers

Timeline


101

Tech & Resource

Key Questions


2020 Biennial Energy Report Webinars

December 4, 2020 Introduction to the 2020 Biennial Energy Report

ODOE is planning a virtual "roadshow" in the new year to share more of the report’s content and uses and to hear feedback about what Oregonians want the future of our energy system to look like – and h​ow to get there.

Sign up to receive email notices about future BER-focused webinars. Provide feedback or request a presentation on specific topics for your organization through our onlin​e comment fo​rm.

More coming soon!